Graphing Regions of Interest
The graphing option for regions of interest can provide a ready-made framework for performing a wide range of pore network simulations to better understand how porous materials behave and how to improve them.
To create a graph of a region of interest that describes a void space, for example, right-click the ROI in the Data Properties and Settings and then choose Create Graph from ROI in the pop-up menu. Graphs of regions of interest can be examined in 3D views, as shown below.
Graph of connected and non-connected porosity

Graph settings, as well as information about the graphed objects, are available on the Data Properties and Settings panel and in the Measurement Inspector, as shown in the following screen captures.
Data Properties and Settings panel

Measurement Inspector

You can do the following in the Data Properties and Settings panel and in the Measurement Inspector:
- Adjust the radius of spheres representing pores or nodes, as well as their connectors.
- Apply different LUTs to ports and adjust measurement ranges by filtering minimum and maximum values in the Measurement Inspector.
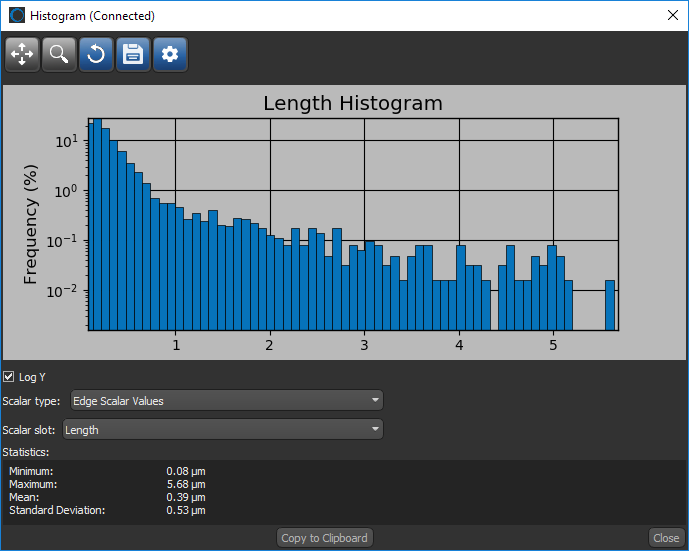
- Plot histograms of selected measurements, as shown below.

- Export results to a CSV file for additional analysis.